![]() USU
››
Programs for business automation
››
Program for the shop
››
Instructions for the program for the store
››
USU
››
Programs for business automation
››
Program for the shop
››
Instructions for the program for the store
››
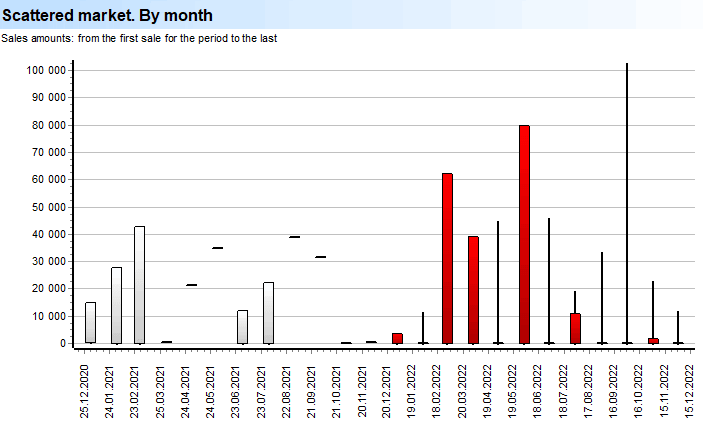
In the ' USU ' program, the analysis of sales amounts is performed using a special report. Report "Sales. Sums" used for in-depth analysis of transaction amounts.
This chart uses professional exchange tools - the so-called " Japanese candlesticks ". Through these technologies, such an economic concept as a "dispersed market" is presented.
" Atomized market " is a market dominated by buyers of different incomes. The vertical line represents the range from the cheapest to the most expensive sale. And the thick bar is the difference between the first and last sale. The bar is red when the last sale is cheaper than the first.
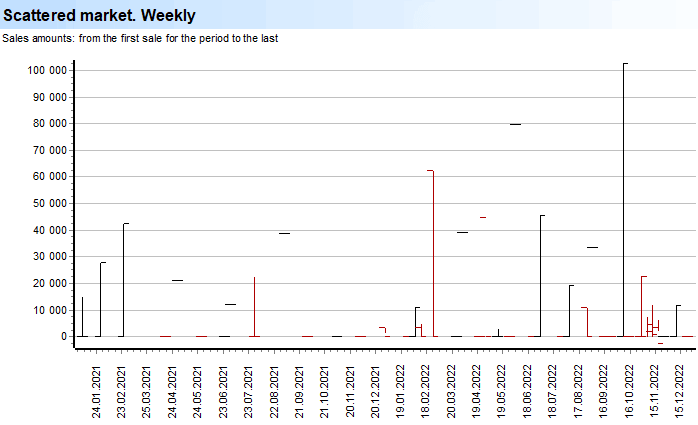
For a more thorough analysis, there is also a weekly view. The amount of the first and last transactions are visualized here by horizontal dashes - to the left and right, respectively.
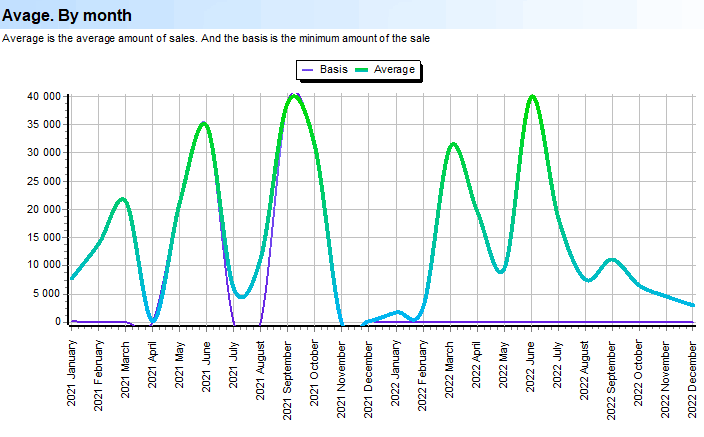
" Average " is the average amount of the sale, calculated in the context of each month. The same chart also shows the "basis" - this is the minimum amount of the sale.
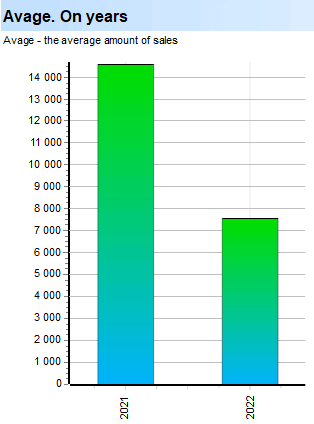
Here, the average is shown in terms of years.
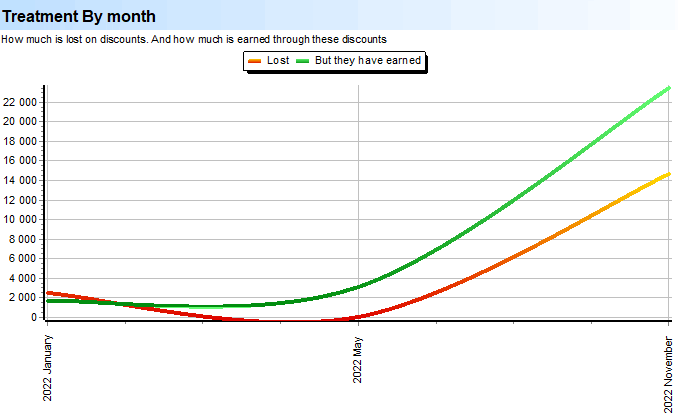
If you, most likely, provide discounts, then you will also be interested in the next analytics - “ lecage ”. Lecage is a loss on the discounts provided. It is shown as a red line on the graph.
Often, if a client is not given a discount, he may not buy anything from you at all, so using this analytics, you can also see the amount of income that was received as a result of those same discounts.
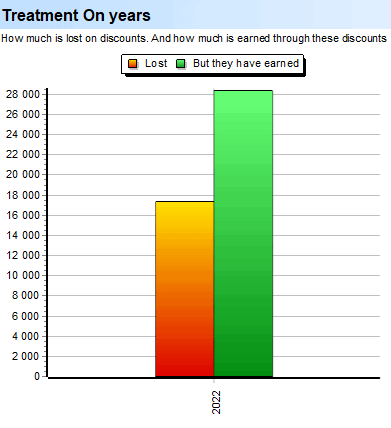
Here the lekage is shown for each year of the period.
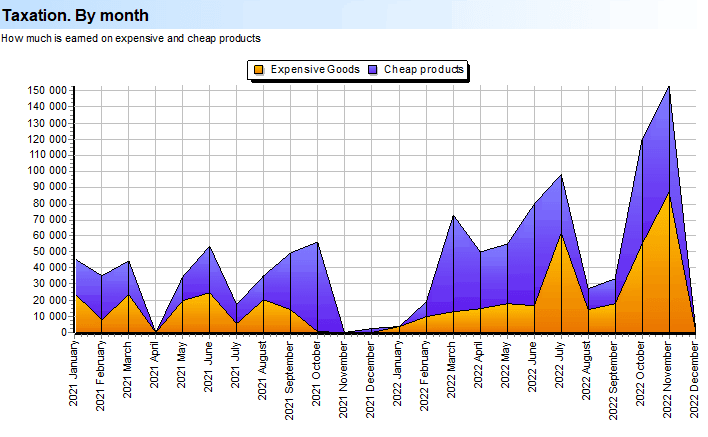
The graph shows such an economic term as " taxation " - pricing policy.
In each group of goods and services there are cheap and expensive offers. If you sell both cheap and expensive products, it is important to understand which ones you earn more from.
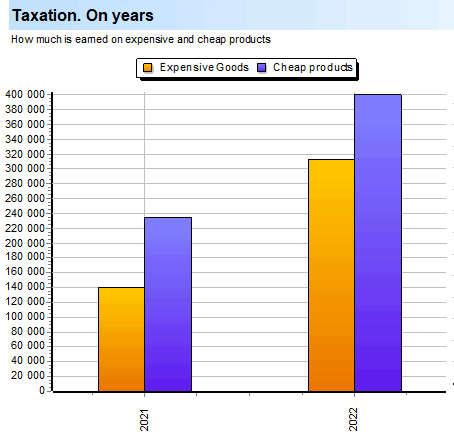
Here taxation is presented in the context of years.
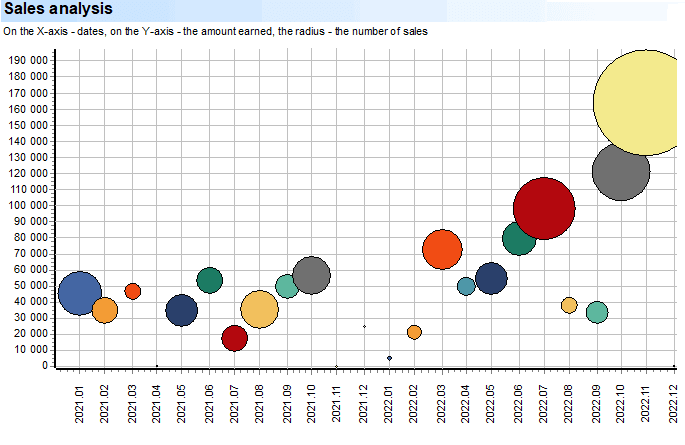
" Sales analysis " is a complex spatial analysis to identify the relationship over time with the amount of turnover and the quantity of goods sold.
On the X axis - the date, on the Y axis - the amount earned. And the radius shows how many goods were sold. This analysis will help you understand whether a business is able to earn a lot with a small amount sold.
See below for other helpful topics:
![]()
Universal Accounting System
2010 - 2026
 Download the program with interactive training