![]() USU
››
Programs for business automation
››
Program for the shop
››
Instructions for the program for the store
››
USU
››
Programs for business automation
››
Program for the shop
››
Instructions for the program for the store
››
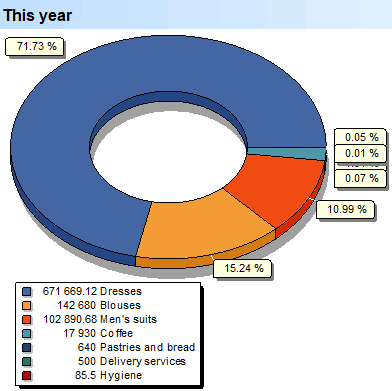
In the ' USU ' program, the analysis of the assortment of a group of goods is performed using a special report. Report "Goods. Subgroups" used to value the subgroups of goods sold and services rendered in financial terms.
Selective demand is the demand for goods and services of various types, which are more or less chosen by the consumer.
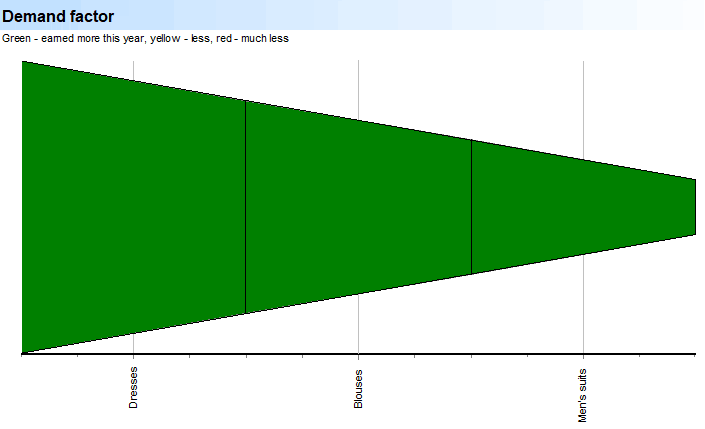
The first graph shows the contribution of each product subgroup to your company's revenue for the year.
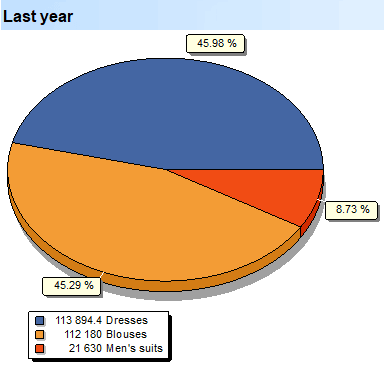
This report shows last year's data by product subgroup.
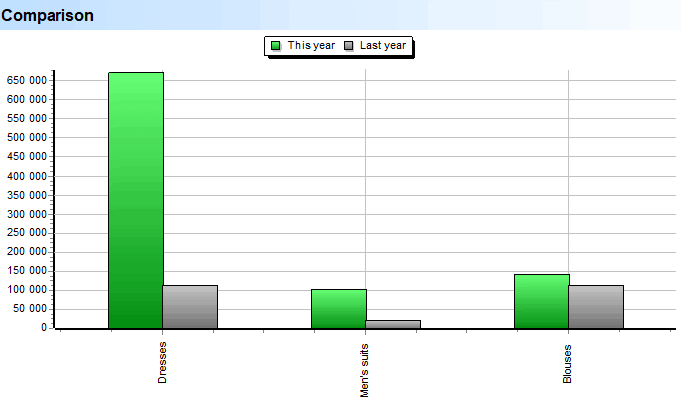
The analytics is used to compare for each subgroup of this year's and last year's indicators.
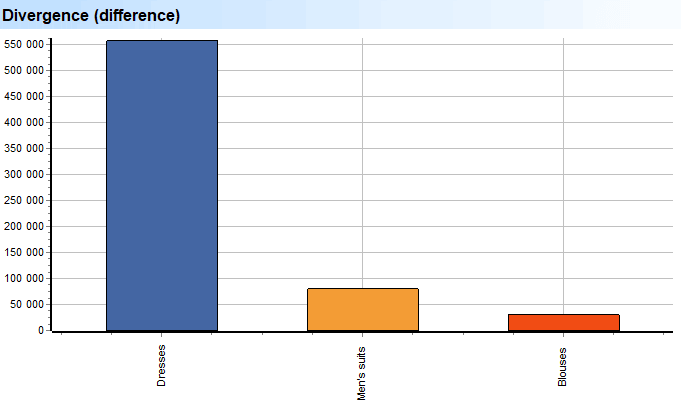
The report immediately shows the difference in income from each subgroup of goods compared to the previous year for a quick comparison of the difference.
This is a demand analysis without financial values. Each subgroup of goods or services is a section-vessel that may or may not be filled completely. If the section is full, then demand this year has exceeded last year's figure. If the demand in the current year was worse - the color is yellow, much worse - red.
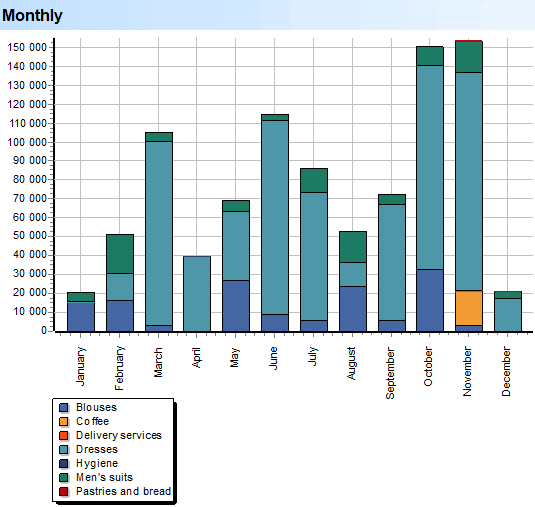
The report is required to assess the contribution of each subgroup of goods or services to the income of each month of the period.
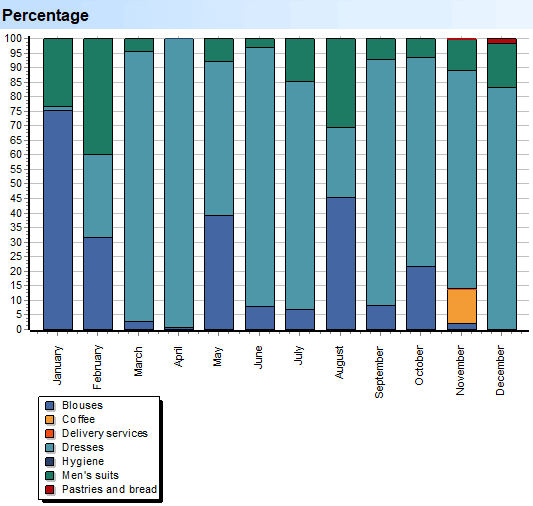
The graph is used to estimate the share of each subgroup's contribution in each month.
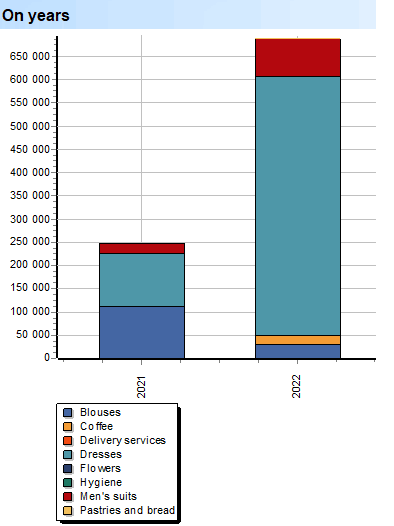
Analysis of income statistics by subgroups of goods or services for all years of the company's operation.
See below for other helpful topics:
![]()
Universal Accounting System
2010 - 2025
 Download the program with interactive training