![]() USU
››
Programs for business automation
››
Program for the shop
››
Instructions for the program for the store
››
USU
››
Programs for business automation
››
Program for the shop
››
Instructions for the program for the store
››
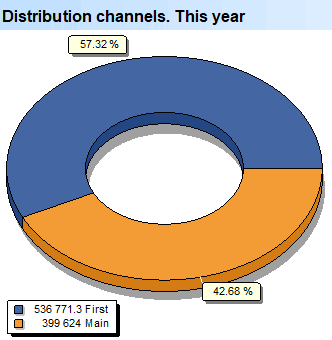
In the ' USU ' program, the analysis of branches and departments is performed using a special report. Report "Branches" necessary to analyze the activities and specialization of your departments and branches.
Each of your branches is a " distribution channel " for products. Through these channels, it will be possible to view detailed statistics: for example, the first graph shows the income for the current year from each branch.
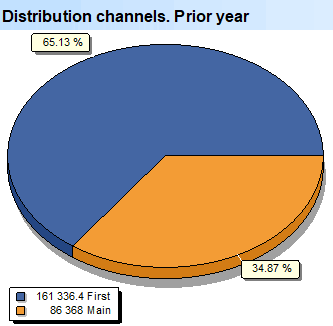
This graph shows the income from your affiliates over the past year.
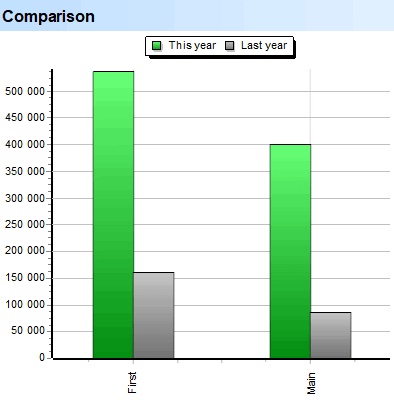
This statistics allows you to compare income from different branches for the current and last year.
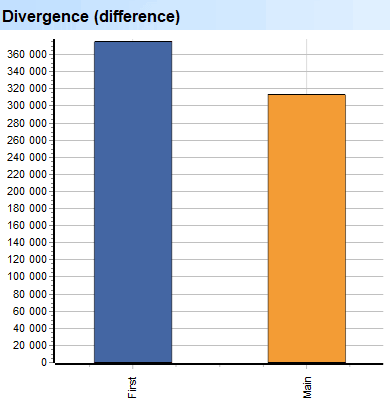
The analysis will immediately show the difference to understand the dynamics of changes in income by branches.
The report shows the income from each branch for each month of the period.
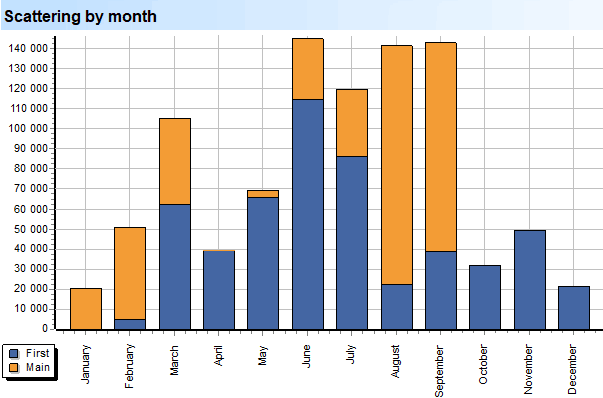
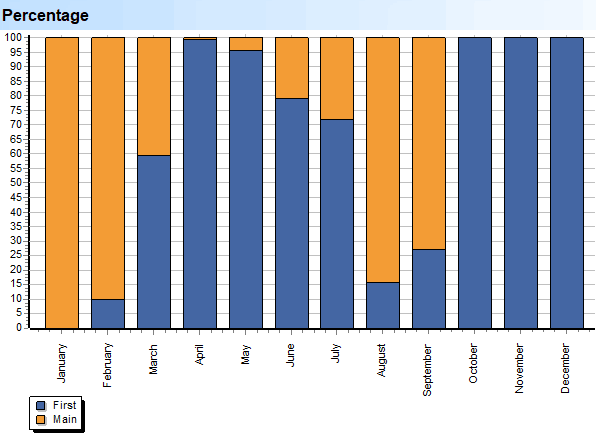
The graph is used to analyze the percentage contribution of each branch to the final income by month.
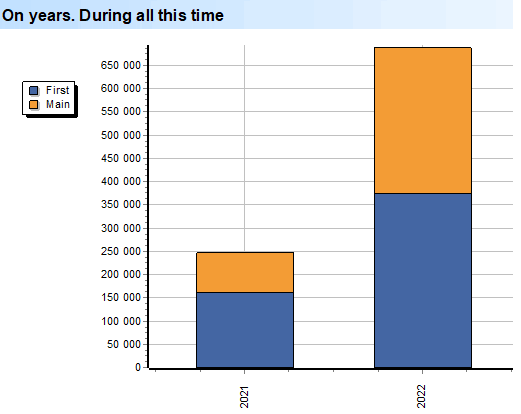
Global analysis for a long period of time by branches.
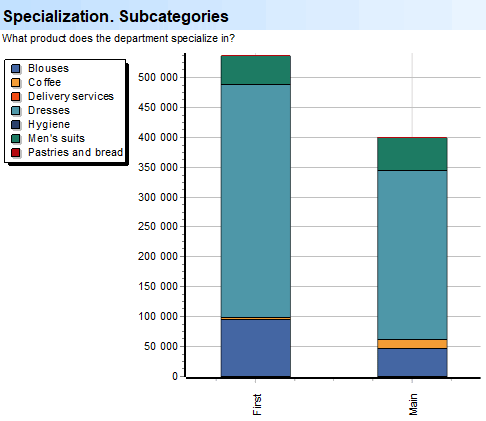
" Specialization " is what each of your divisions is more specialized in. For each branch, it is visualized which types of product or service categories mainly make up its income. And also for each type of product it is clear in which branch it is sold more actively. You can easily identify the most popular groups of goods and services.
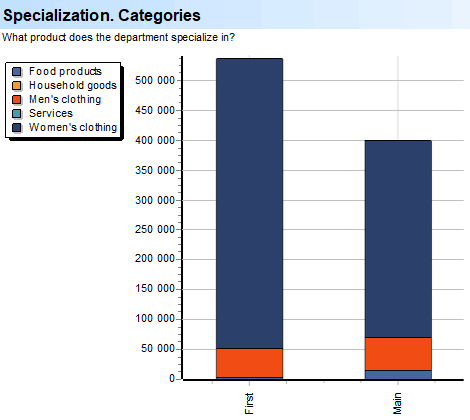
This chart allows you to evaluate already subgroups of goods and services for each branch.
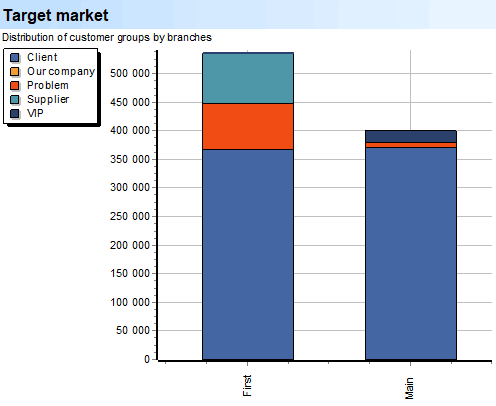
From this diagram, it will become clear which customer groups prevail in each division. And also - in what ratio each group of clients is distributed among the branches.
See below for other helpful topics:
![]()
Universal Accounting System
2010 - 2025
 Download the program with interactive training