![]() USU
››
Programs for business automation
››
Program for the shop
››
Instructions for the program for the store
››
USU
››
Programs for business automation
››
Program for the shop
››
Instructions for the program for the store
››
In the ' USU ' program, the analysis of the cost structure is performed using a special report. Report "Expenses. Subgroups" to analyze your expenses divided into convenient subgroups.
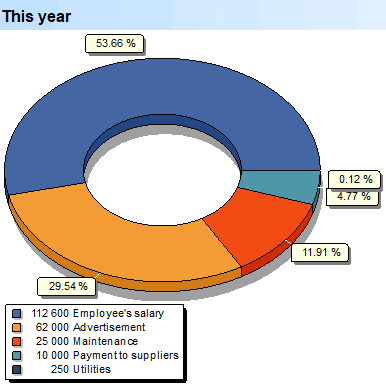
The graph is used to estimate where more funds are spent in the current year by subgroups of financial items. Near each segment it is signed what percentage this part is of the total volume.
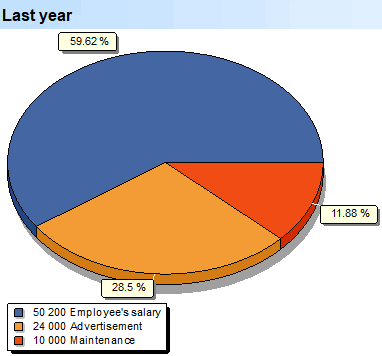
This is already an analysis of the previous year by subgroups of financial items.
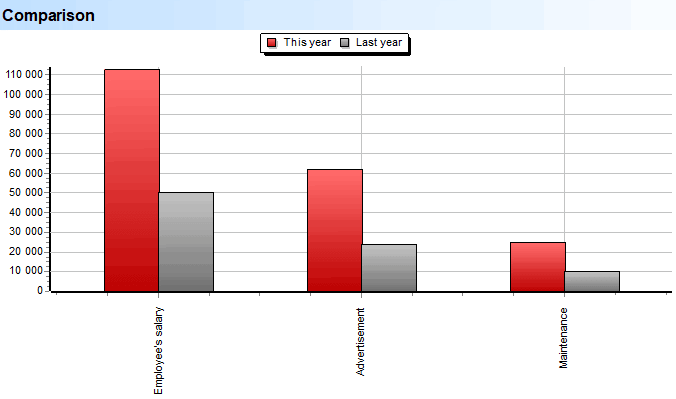
Dynamics of change by subgroups of expenses of the current year compared to the previous year.
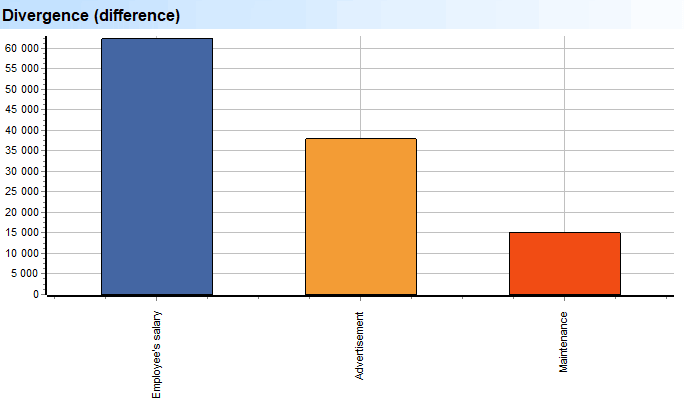
Total difference for each expense subgroup. Moreover, the costs are immediately sorted in the order in which they have changed the most compared to last year.
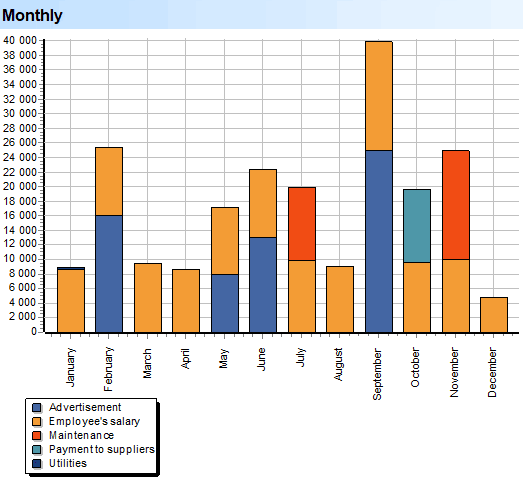
If we scatter the costs by months, it will be very clearly visible. First, what expenses are included in each month. Secondly, for each type of expenditure, it will be easy to track the dynamics of change over time.
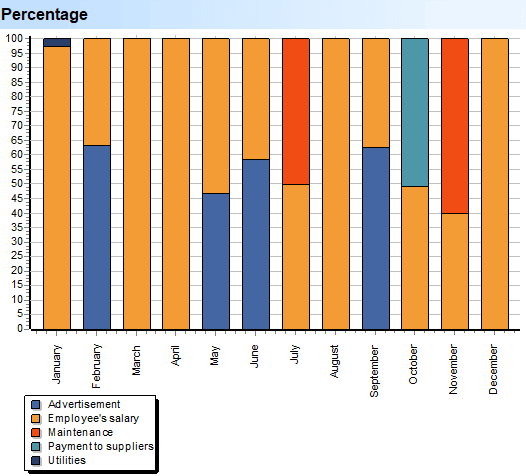
The following graph is an opportunity to look at the dispersion of expenses by month, neglecting the amounts, leaving only the percentage by subgroup.
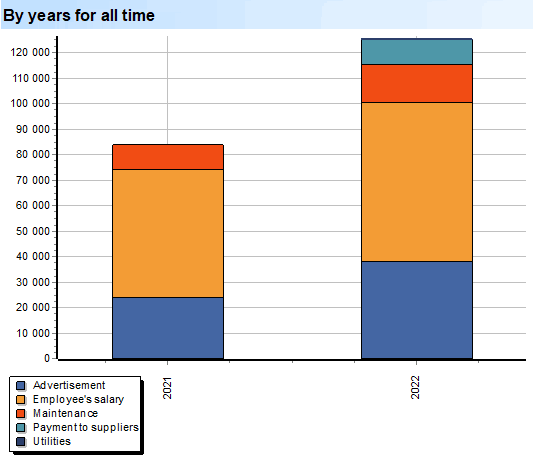
A more enlarged version of dispersion is also presented by years for the entire period of the company's operation. This is especially useful when the company is developing, while some types of expenses disappear, others appear. But you can be sure that nothing will be lost from the analysis.
See below for other helpful topics:
![]()
Universal Accounting System
2010 - 2025
 Download the program with interactive training