![]() USU
››
Programs for business automation
››
Program for the shop
››
Instructions for the program for the store
››
USU
››
Programs for business automation
››
Program for the shop
››
Instructions for the program for the store
››
In the ' USU ' program, the analysis of the volume of sales of goods is performed using a special report. Report "Basket. Volumes" allows you to analyze the consumer's basket.
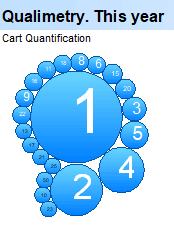
Qualimetry is a scientific direction that develops methods for quantitative assessment. It is necessary to understand not only how many types of different goods are in the consumer's basket, but also to analyze how many units of goods are in the basket. Even if it's the same product.
This cart scoring is visualized using state-of-the-art cloud technology and will show how many products and services a customer typically purchases from you in the current year.
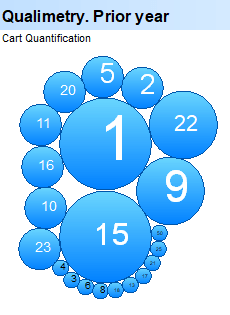
This graph will show how many products and services a customer typically purchased from you in the past year.
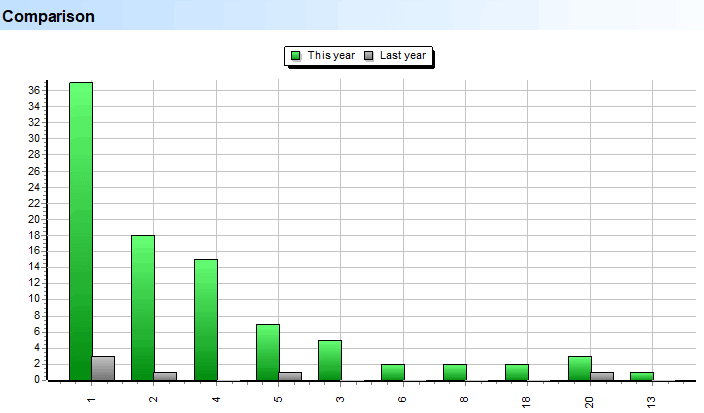
The report will allow you to compare the change in the volume of goods and services by customers this year compared to the past.
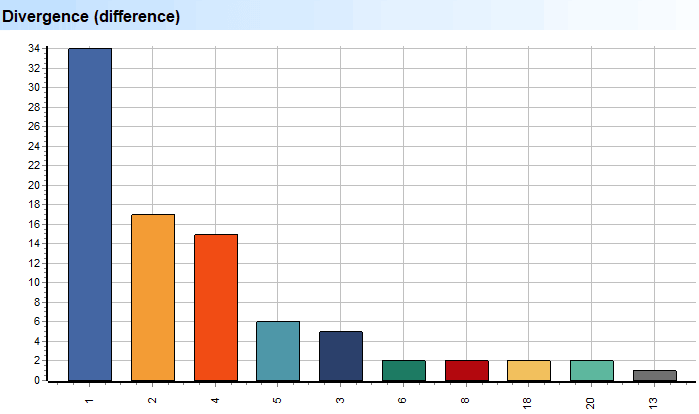
The report will immediately show the difference in the volume of goods and services for customers this year compared to the last.
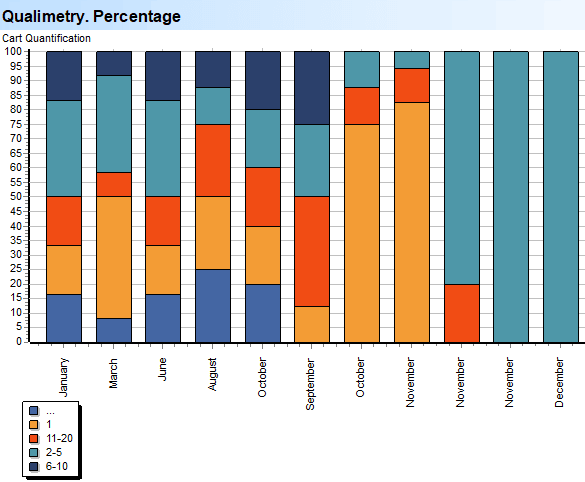
The chart will show what part each volume of purchases occupies in each month of the selected period.
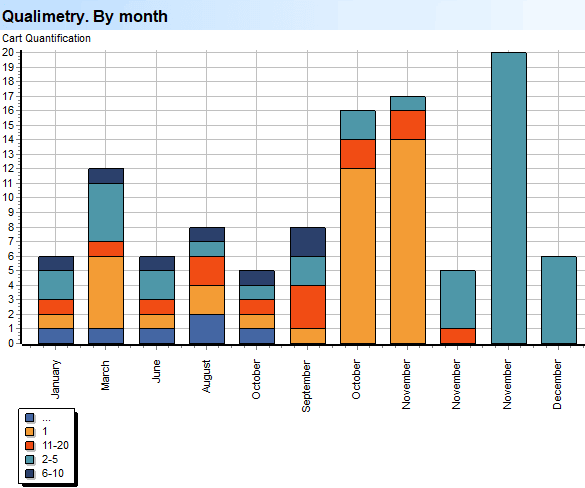
The chart will show the percentage of purchase volumes in each month of the selected period.
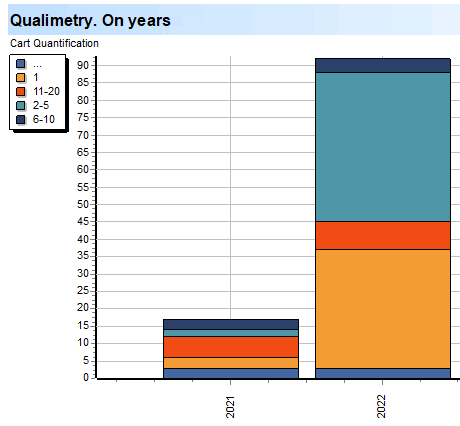
With the help of the report, you can evaluate how the volume of your shopping cart has changed over the years.
See below for other helpful topics:
![]()
Universal Accounting System
2010 - 2026
 Download the program with interactive training