![]() USU
››
Programs for business automation
››
Program for the shop
››
Instructions for the program for the store
››
USU
››
Programs for business automation
››
Program for the shop
››
Instructions for the program for the store
››
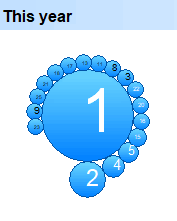
In the ' USU ' program, the analysis of the quantity of goods is performed using a special report. Report "Basket. Goods" allows you to analyze the consumer's basket.
It all starts with an analysis of the number of goods in this very basket. It is important that the client does not buy just one thing. This analytics, through a modern representation in the form of a “cloud”, will show how many types of goods and services a client usually purchases from you.
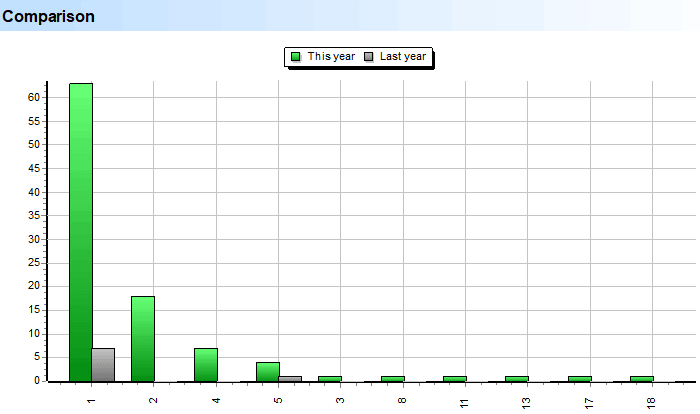
There is a comparative analysis relative to the previous year. With it, you can easily see the result if you have worked hard to increase the number of items you can buy together.
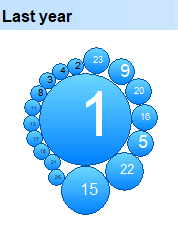
If you are trying to offer customers additional services or products, then you can easily follow the positive dynamics of such a policy through this graph.
"Divergence" is the difference from last year. In the case of a diversified product basket of buyers, the columns showing sales, where two or more services or goods were purchased at a time, will have to grow.
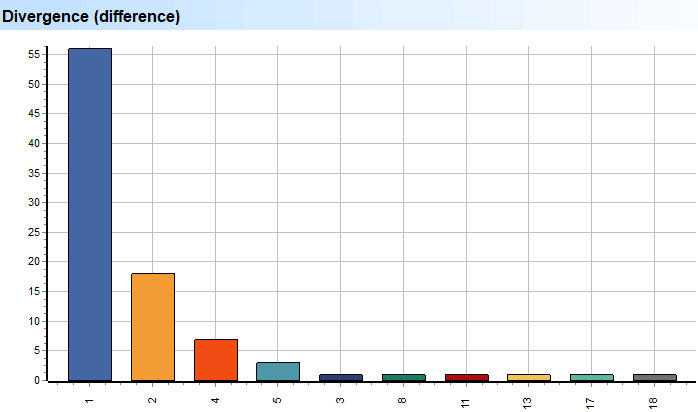
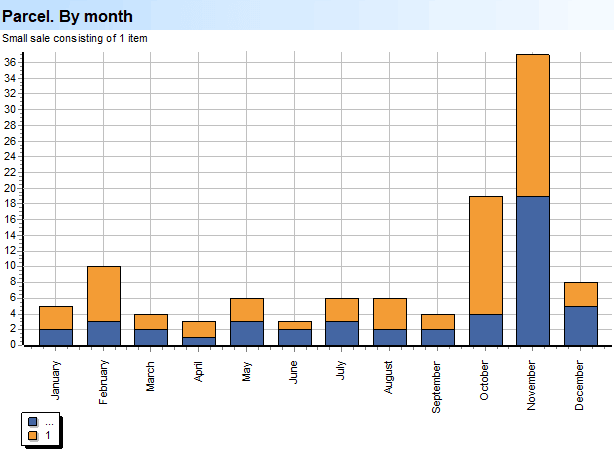
Parcel is a small batch of goods. Analytics shows when only one type of product is bought, and not a group of different goods and services. The results are displayed broken down by each month of the company's operation.
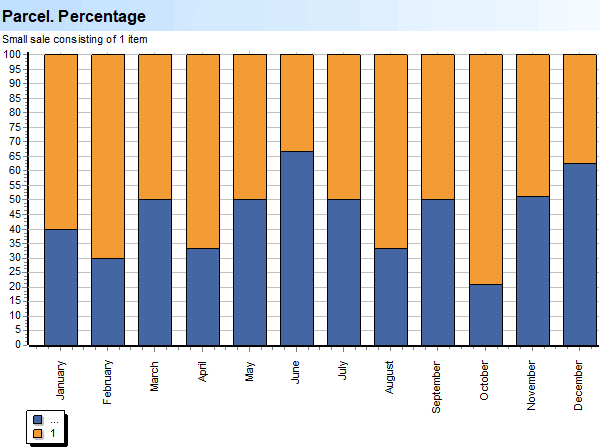
The graph is an analytical view, ignoring sums for a quick understanding of percentages.
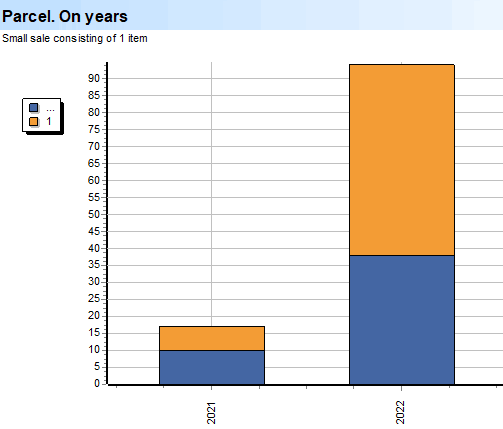
This aggregated analysis is presented by year.
See below for other helpful topics:
![]()
Universal Accounting System
2010 - 2026
 Download the program with interactive training