
Operating system: Windows, Android, macOS
Group of programs: Business automation
Spreadsheets for a laboratory
- Copyright protects the unique methods of business automation that are used in our programs.

Copyright - We are a verified software publisher. This is displayed in the operating system when running our programs and demo-versions.

Verified publisher - We work with organizations around the world from small businesses to large ones. Our company is included in the international register of companies and has an electronic trust mark.

Sign of trust
Quick transition.
What do you want to do now?
If you want to get acquainted with the program, the fastest way is to first watch the full video, and then download the free demo version and work with it yourself. If necessary, request a presentation from technical support or read the instructions.

Contact us here
How to buy the program?
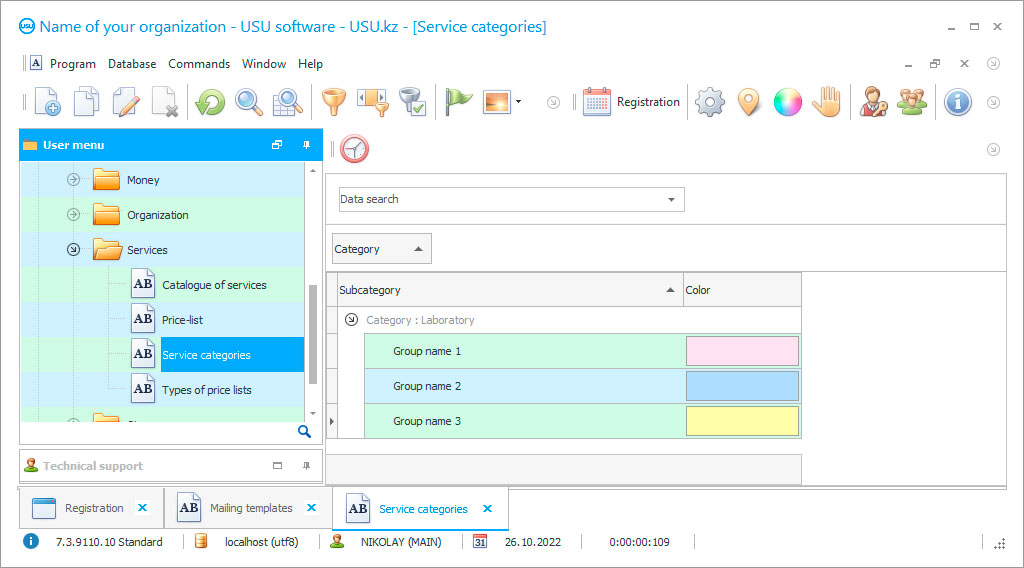
View a screenshot of the program
Watch a video about the program
Download demo version
Compare configurations of the program
Calculate the cost of software
Calculate the cost of the cloud if you need a cloud server
Who is the developer?
Program screenshot
Spreadsheets for the laboratory can be compiled in the USU Software, which is one of the best functional laboratory information system, are always filled in automatically — the information in them is loaded by the automated system itself, collecting it from those spreadsheets that are placed in the laboratory logs of users that they fill with data yourself.
The user's laboratory log is a strictly personal document. The work in the spreadsheets placed in the personal journal is performed by the user as part of his duties, filling the spreadsheets with work readings, which he receives as tasks are ready. This laboratory information system selects all values from the spreadsheets of personal logs, sorts them by purpose, processes them, and then adds them in the form of aggregate current indicators to spreadsheets for the laboratory log, which will already be available to those specialists whose competence includes such information.
Furthermore, filling out the spreadsheets for the laboratory journal does not take place directly, but indirectly, which allows you to avoid placing false data in such an information system, since, operating with data from the spreadsheets of personal journals, it automatically rejects information that does not correspond to the current situation — the information goes through automatic information control before being taken into account by the laboratory.
Who is the developer?

Akulov Nikolay
Expert and chief programmer who participated in the design and development of this software.
2024-05-05
Video of spreadsheets for a laboratory
This video can be viewed with subtitles in your own language.

Spreadsheets for the laboratory information system have a convenient look for studying the information contained in them. Each employee can reformat the spreadsheet, hide unnecessary columns and rows, swap them, add additional columns — make the spreadsheet look according to his priorities in working with their content. And each employee in the laboratory can do these actions with the spreadsheets, giving the spreadsheets their own format, however, while the public version of the spreadsheet for the laboratory journal will have its original appearance.
The software configuration according to the spreadsheets for the laboratory divides the access rights of users, allocating each a separate information space, which they get into if he has an individual login and a password that protects them, it is in this information space that his personal laboratory journals are located, to which only they and their management have access whose responsibilities include regular monitoring of laboratory’s user logs, their content, spreadsheets, to assess their compliance with real laboratory processes. The configuration according to spreadsheets for the laboratory provides an audit function for conducting such control, which speeds up the procedure by generating a spreadsheet with all the changes in the laboratory information system that have occurred in it since the last inspection, thereby significantly reducing the information volume and, accordingly, the amount of work laboratory management.
Advanced configuration according to the spreadsheets for the laboratory allows you to embed any diagrams in the spreadsheets for the laboratory journal, they demonstrate the state of the indicator at the current moment — the degree of its achievement of the required value, which allows you to visually control the indicators and the situation. The laboratory spreadsheet configuration uses color indicators in the spreadsheets, allowing the laboratory to also visually assess the reality.
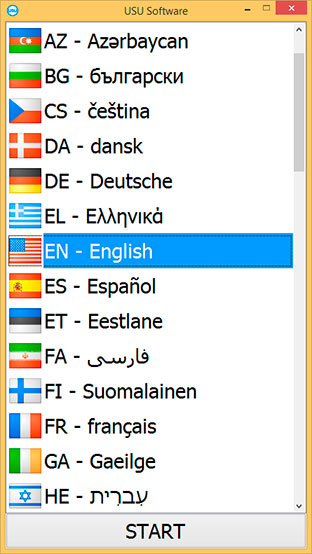
Download demo version

When starting the program, you can select the language.
Who is the translator?

Khoilo Roman
Chief programmer who took part in the translation of this software into different languages.
For example, when compiling a spreadsheet on receivable financial accounting, the configuration for spreadsheets for a laboratory colors the cells with debtors in a certain color, the intensity of which indicates the amount of debt — the higher it is, the stronger the color, which immediately shows the priority of contacts. The laboratory information system has the task of minimizing the costs of the laboratory for operational activities, including material, monetary, time, and others, so it uses a variety of tools to achieve its goals.
The configuration according to spreadsheets for the laboratory automatically performs many various duties, relieving staff of them and giving them the opportunity to devote more time to research, which will increase the volume of production and piece-rate monthly remuneration, since the information system automatically calculates it according to the number of finished tasks marked in personal logs. Otherwise, the program cannot estimate the volume of execution. On this basis, we observe a surge in user activity in filling personal journals, which provides the system with a constant flow of fresh information, both primary, current.
The laboratory receives the entire package of documentation, which it operates in the process, automatically compiled — the documents are ready for the deadline set for each of them and include all types of reporting, including accounting, invoices, standard contracts, route lists, but most importantly — applications to suppliers from already the calculated purchase volume based on the inventory turnover, which allows the laboratory to reduce its costs for the supply and storage of surplus unclaimed in this period. The software runs on the Windows operating system and has mobile applications on iOS and Android platforms designed for both staff and customers.
Order a spreadsheets for a laboratory
To buy the program, just call or write to us. Our specialists will agree with you on the appropriate software configuration, prepare a contract and an invoice for payment.
How to buy the program?


The program will be installed
If the program is purchased for 1 user, it will take no more than 1 hour
Buy a ready-made program


Also you can order custom software development
If you have special software requirements, order custom development. Then you won’t have to adapt to the program, but the program will be adjusted to your business processes!

Spreadsheets for a laboratory
Our program uses unified electronic documents and data entry windows with built-in lists with multiple choice answers. All databases have the same format — a list of their members and a panel of tabs for detailing their properties, each tab has one quality, each database has its own panel. The nomenclature range is classified by product categories, their catalog is attached, in the absence of the required reagent, it allows you to find a replacement with similar properties. Nomenclature items have a number and personal trade characteristics for their identification among analogs — bar code, factory article, manufacturer, supplier.
To control the movement of nomenclature items, invoices are used, from which a base of primary accounting documents is formed, each has a status according to the type of transfer. To account for customers, a single database of contractors is formed, where, in addition to customers, there are also suppliers, contractors, divided by status, inside it — into categories by quality. If you wish to maintain the activity of clients, they use advertising and information mailings — electronic communication works for them in the form of e-mail, SMS. To organize mailings, nested text templates are used, the spelling function works, the list is formed automatically according to the specified criteria, there are exceptions. At the end of the period, a report on mailings is compiled with an assessment of feedback — the number of people who applied, the number of calls in general, the profit received from this mailing in general. At the end of any financial period, many other reports are drawn up with an analysis of all laboratory activities and an assessment of the effectiveness of personnel, client activity, and demand for analyzes.
Activity analysis reports have a tabular and graphical view, convenient for finding trends, with visualization of the significance of each indicator in the total cost and profit. The USU Software identifies non-productive costs and inappropriate expenses, demonstrates cash flow, shows income items by source. The personnel summary identifies the most effective employees, the assessment is based on the volume of work, time expenses, profit made, and a client's income rating is also formed. Analysis of activities reveals factors of negative influence on the formation of profits, and substandard products show the level of demand for each service your company provides!