![]() USU
››
Programs for business automation
››
Program for clinic
››
Instructions for the medical program
››
USU
››
Programs for business automation
››
Program for clinic
››
Instructions for the medical program
››

![]() These features are available only in the Standard and Professional program configurations.
These features are available only in the Standard and Professional program configurations.
![]() Here we have learned
Here we have learned ![]() embed an entire chart to visually see the most important values.
embed an entire chart to visually see the most important values.
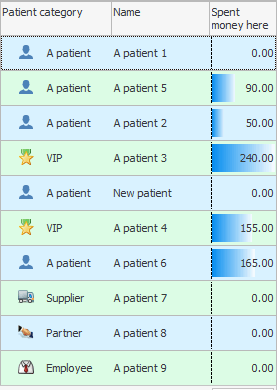

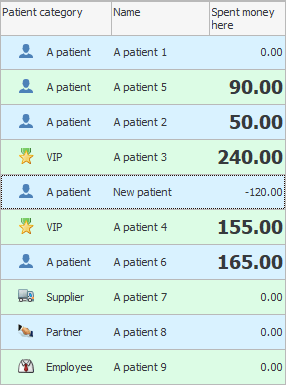
You can rank the values. To do this, let's in the module "Patients" at the column "Total spent" automatically find the average value. To get a clear idea of how much money the average patient spends in your clinic. To do this, we go to the command we already know "Conditional Formatting" .
![]() Please read why you will not be able to read the instructions in parallel and work in the window that appears.
Please read why you will not be able to read the instructions in parallel and work in the window that appears.
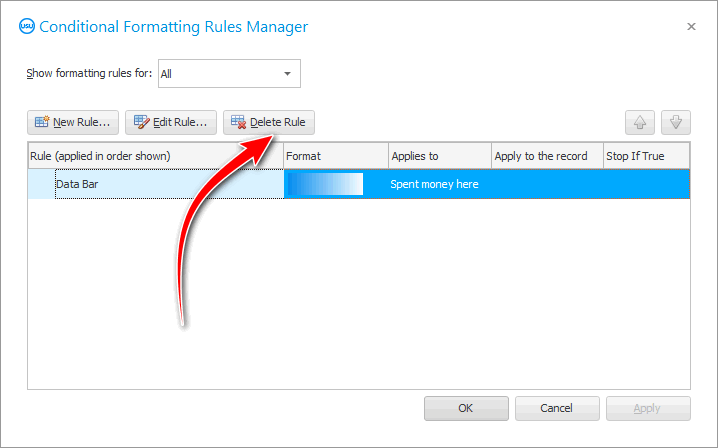
If you still have formatting rules from the previous examples, delete them all.
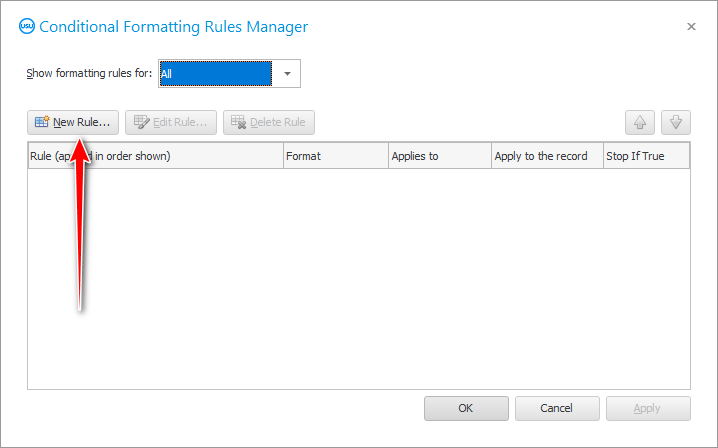
Then add a new rule using the ' New ' button.
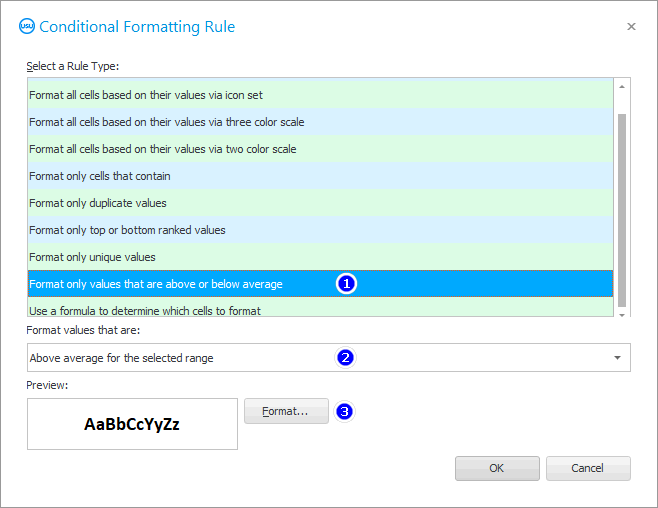
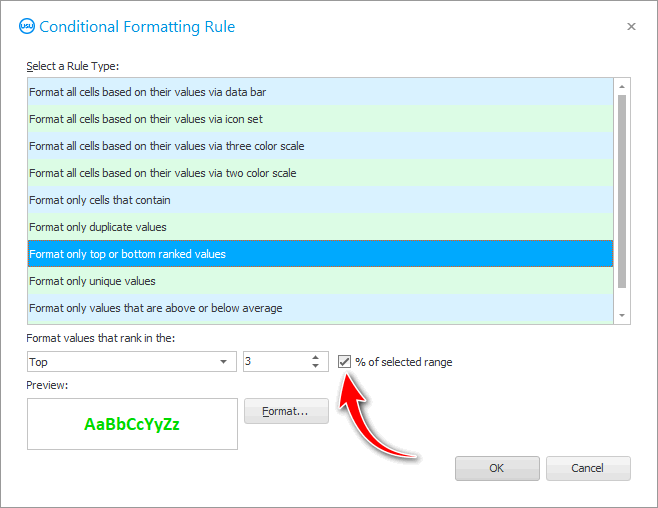
In the window that appears, select the rule ' Format only values that are above or below average '. Then, in the drop-down list below, select ' Greater than or equal to the average of the selected range '. On pressing the ' Format ' button, change the font size a bit and make the font bold.
As a result, we will highlight clients who have spent a good amount of money in your medical center. The amount will be equal to or greater than the average for the clinic.
Moreover, the selection of values will automatically change over time. After all, yesterday the average value was equal to one sum, and today it can already be completely different.
![]() There is a special report that analyzes the average purchasing power .
There is a special report that analyzes the average purchasing power .
You can set a formatting condition that will show ' Top 10 ' or ' Top 3 ' of the best customers.
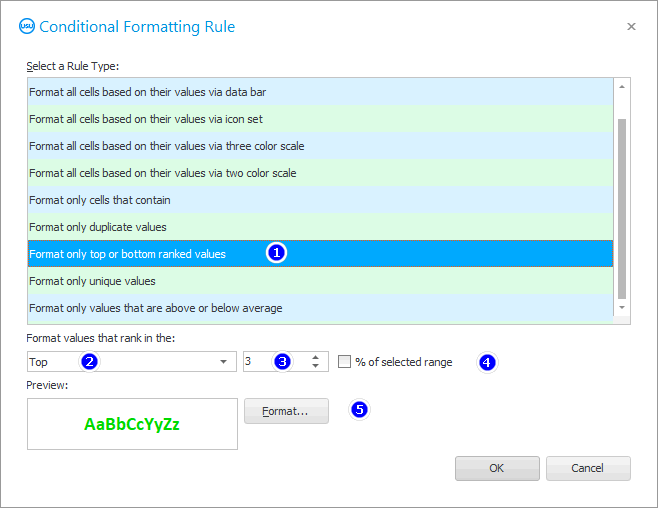
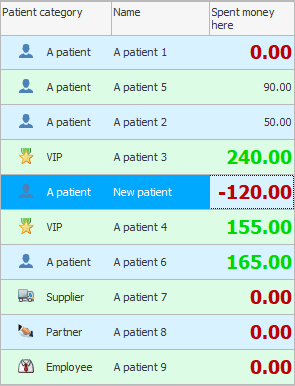
We will display such patients in green font.
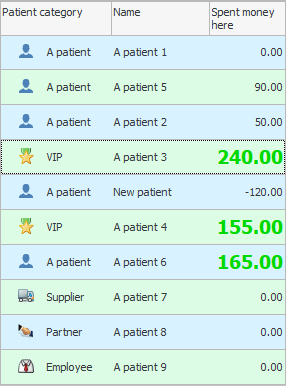
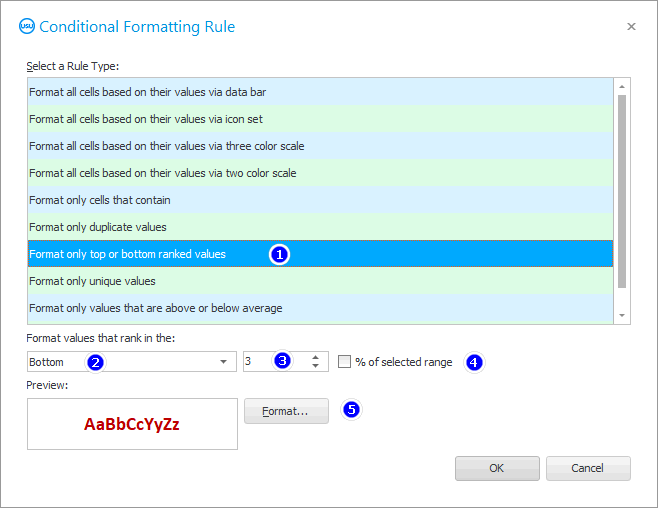
Let's add a second condition to highlight the ' Top 3 ' worst patients. Their amounts of funds spent will be displayed in red font.
Make sure that both formatting conditions will be applied for the ' Total Spent ' field.
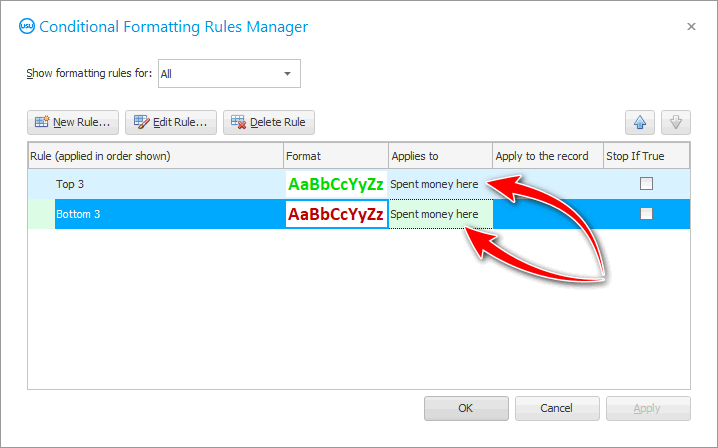
Thus, in the same data set, we will get a ranking of ' Top 3 Best Patients ' and ' Top 3 Worst Patients '.

When there are a lot of patients, it is possible to build your own ' Top 3 ' rating, where ' 3 ' will not be the number of people to be found in the general list, but the percentage of the total client base. Then you can easily bring out the 3 percent of the best or worst patients. To do this, simply check the ' % of the selected range ' checkbox.

![]() The program will automatically show you in any table
The program will automatically show you in any table ![]() unique values or duplicates .
unique values or duplicates .
See below for other helpful topics:
![]()
Universal Accounting System
2010 - 2024
 Download the program with interactive training